Network Visualization
The Viking web services can export files for use in external tools.
For more technical users exporting directly using URL’s is documented below
Prerequisites
Tulip Analysis Plugin
Ethan Kerzner has developed TulipPaths a set of useful plugins for analyzing graphs in Tulip.
Export from the web page
This user friendlier website exports files for Marc lab hosted databases.
Export directly from a URL
Exports are available under a volume URL’s /export/ subpath. An Export URL has the following components
- GET /export/( report_type )/( format )/
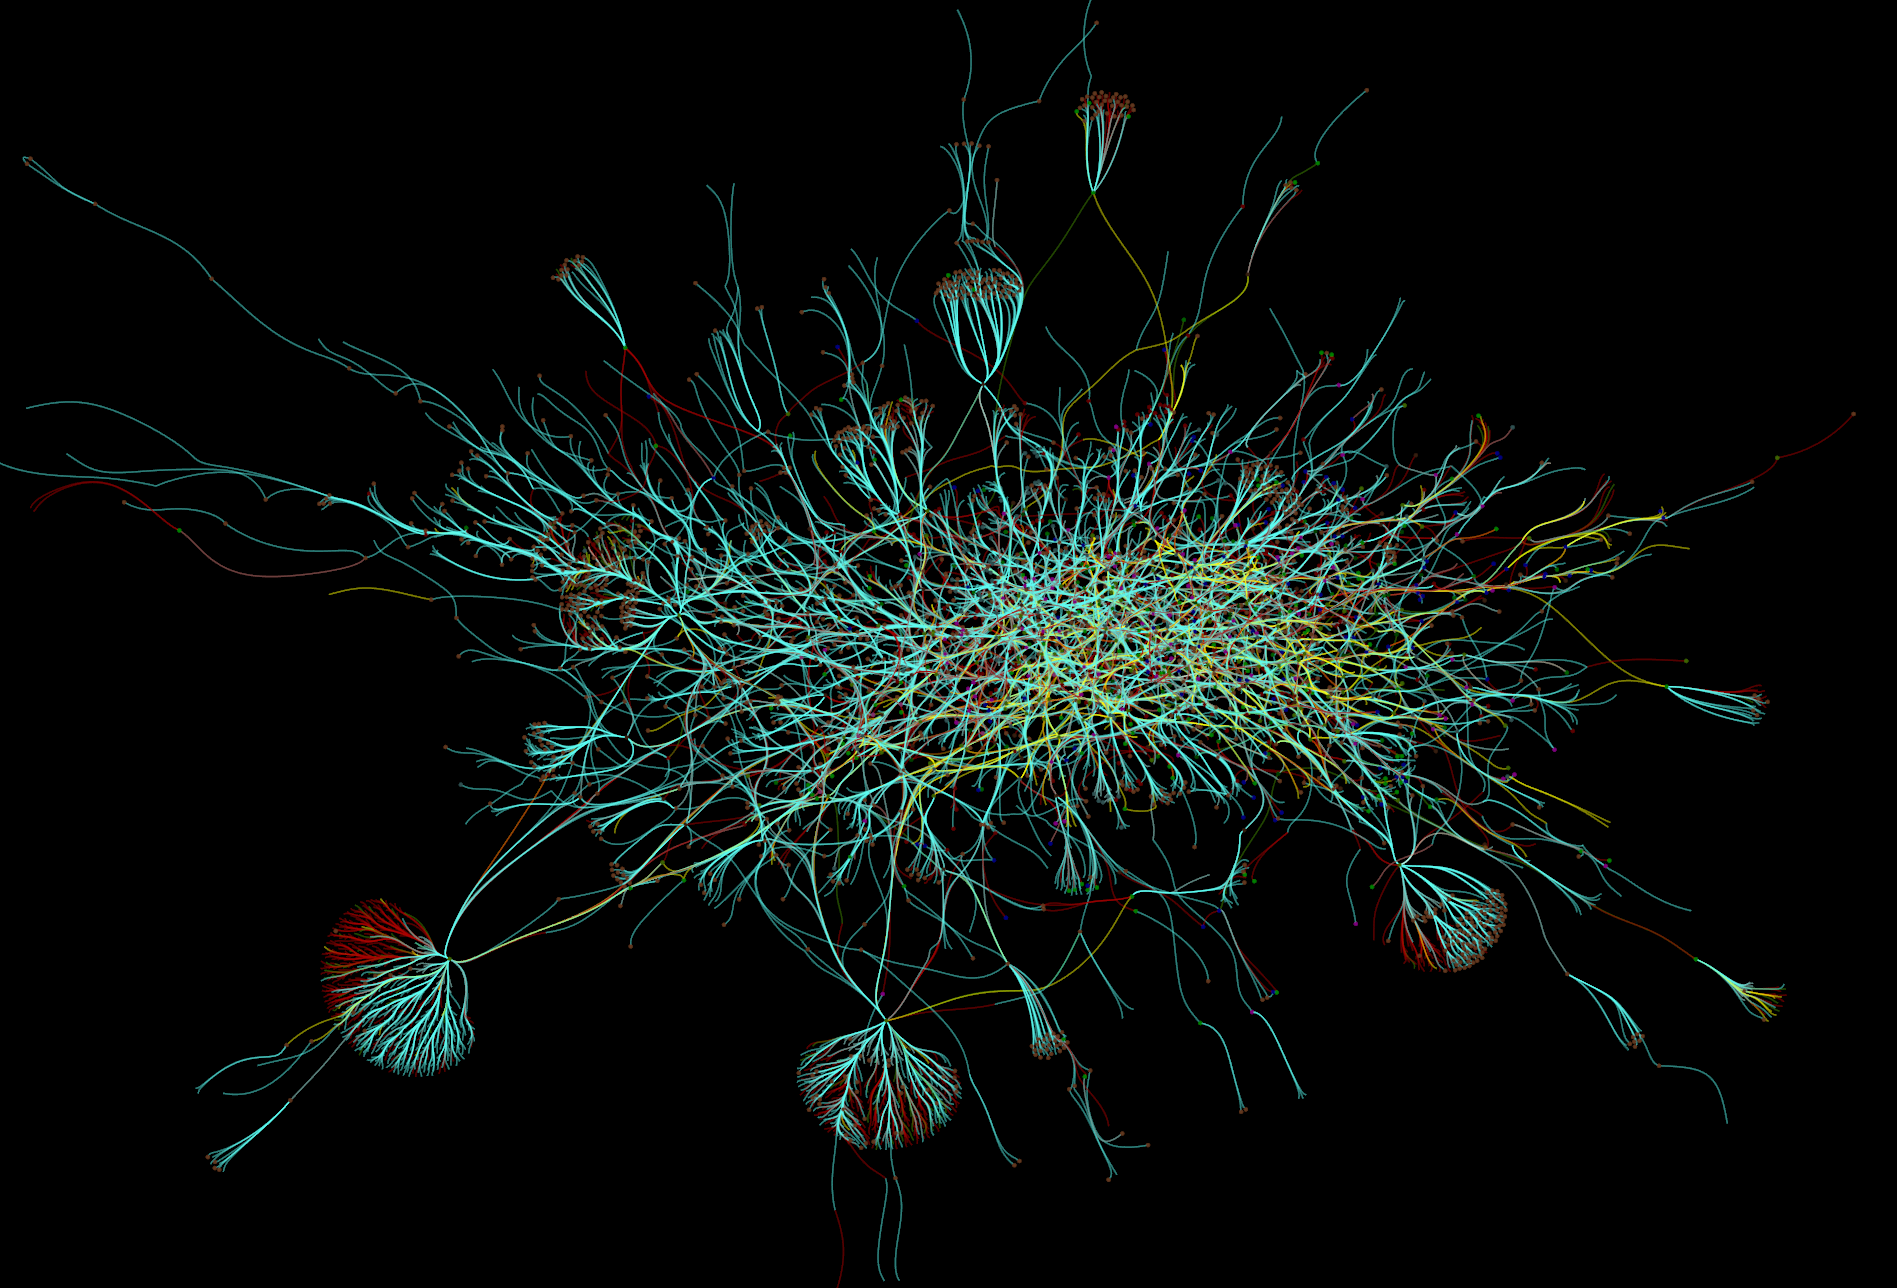
Neuron connectivity network
Neuronal connectivity graphs map nodes to individual neurons (parent structures). Edges are the collection of all connections between neurons grouped by type.
- GET /export/network/( Format )
Requests the connectivity graph for the neurons specified in the query string.
- Format:
TLP - Tulip file format
DOT - Graphviz DOT file format
GraphML - GraphML file format
JSON - Java script object notation
- Query Parameters
id – ID numbers of cells to include in connectivity graph. Commas separate multiple IDs.
hops – Degrees of seperation to include additional neurons in graph
- Response Headers
Content-Type – text/plain
Example request
Get all cells within one degree of seperation of cells 476 and 514.
http://websvc1.connectomes.utah.edu/RC1/export/network/tlp?id=476,514&hops=1
Get all cells in the network:
http://websvc1.connectomes.utah.edu/RC1/export/network/tlp
Neuron Node Properties:
Area - Surface area in square nm
MinZ - Mininum section number the structure occurs upon
MaxZ - Maximum section number the structure occurs upon
MaxDimension - Dimension of the annotations used to markup the structure. 1 for line annotations, 2 for circles/polygons
StructureURL - Link to structure in OData server
Tags - Tags users have added to the structure
Volume - Volume of the structure in cubic nm
Neuron Edge Properties:
Directional - True if the connection is a one-way path, i.e. synapses. False if the connection is two way, i.e. gap junctions.
EdgeType - The type of connection, synapse, ribbon, gap junction, etc…
IsLoop - True if the edge connects between two annotations on the same structure.
LinkedStructures - A list of the child structures linked in the database that define this edge.
MinZ - Mininum section number an instance of this edge occurs upon.
MaxZ - Maximum section number an instance of this edge occurs upon.
TotalSourceArea - Total surface area of the source side of all linked source structures, i.e. Total area of all membrane patches.
TotalTargetArea - Total surface ara of the target side of all linked target structures, i.e. Total area of post-synaptic densities.
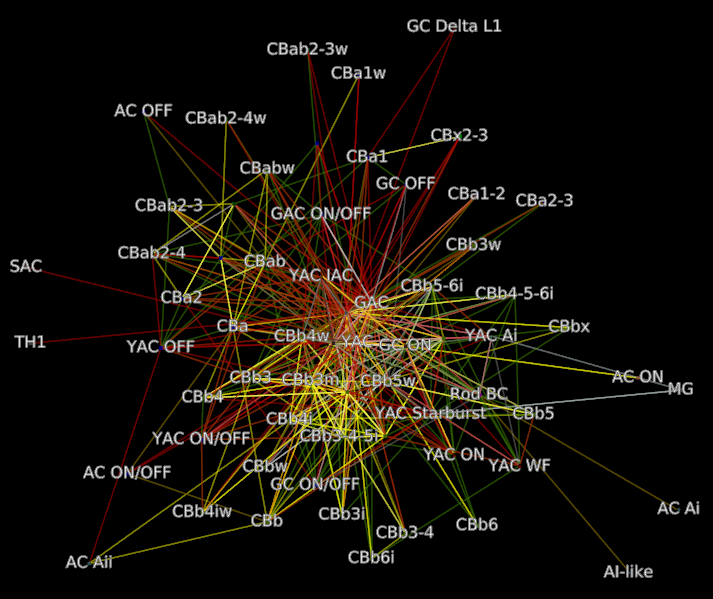
Motif connectivity
Motif connectivity graphs group all neurons (Structures) by label and map each label to a node. Edges are the collection of all connections between those labels grouped by type.
- GET /export/motif/( Format )
Connectivity between classes of neurons based on label. Includes all neurons. Nodes represent the set of all structures that share a label. Edges indicate at least one connection between cells with those labels.
- Format:
TLP - Tulip file format
DOT - Graphviz DOT file format
GraphML - GraphML file format
JSON - Java script object notation
- Response Headers
Content-Type – text/plain
Example request
Get a dot file of the morphology for use in Graphviz
http://websvc1.connectomes.utah.edu/RC1/export/motifs/dot
Motif Node Properties:
NumberOfCells - Total number of cells with this label that have an edge in the database
InputTypeCount - Total distinct types of inputs, i.e. { CB1 -> X, CB2 -> X} X has 2 Input types
OutputTypeCount - Total distinct types of outputs, i.e {X => CB1, X=> CB2, X => CB3} X has 3 output types
BidirectionTypeCount - Total distinct types of bidirectional outputs, i.e { X <=> A2} X has 1 bidirectional output type
StructureIDs - A list of StructureIDs that share this label
StructureURL - A URL to load the structure from the ODATA server
MorphologyURL - A URL to load morphology for cells with this label
Motif Edge Properties:
EdgeType - The type of connection, synapse, ribbon, gap junction, etc…
SourceParentStructures - The parent structures of the edges source structures. i.e, the cell that contains the synapse
TargetParentStructures - The parent structures of the edges target structures. i.e, the cell that contains the post-synaptic density
ConnectionSourceStructures - The structures that are sources of the edge, i.e. The synapses
ConnectionTargetStructures - The structures that are targets of the edge, i.e. The post-synaptic density
%OccurenceInSourceCells - How many of the source node’s cells originate this connection
%OccurenceInTargetCells - How many of the target node’s cells receive this connection
%ofSourceTypeOutput - How much of the total output of the source node does this edge represent
%ofTargetTypeInput - How much of the total input of the target node does this edge represent
%ofSourceTypeBidirectional - How much of the bidirectional connections to the source node does this edge represent
%ofTargetTypeBidirectional - How much of the bidirectional connections to the target node does this edge represent
Avg#OfOutputsPerSource - Average number of outgoing connections an individual cell makes to the target type
Avg#OfInputsPerTarget - Average number of incoming connections an individual cell receives from the source type
StdDevOfOutputsPerSource - The standard deviation of outgoing connections an individual cell makes to the target type
StdDevOfInputsPerTarget - The standard deviation of incoming connections an individual cell receives from the source type
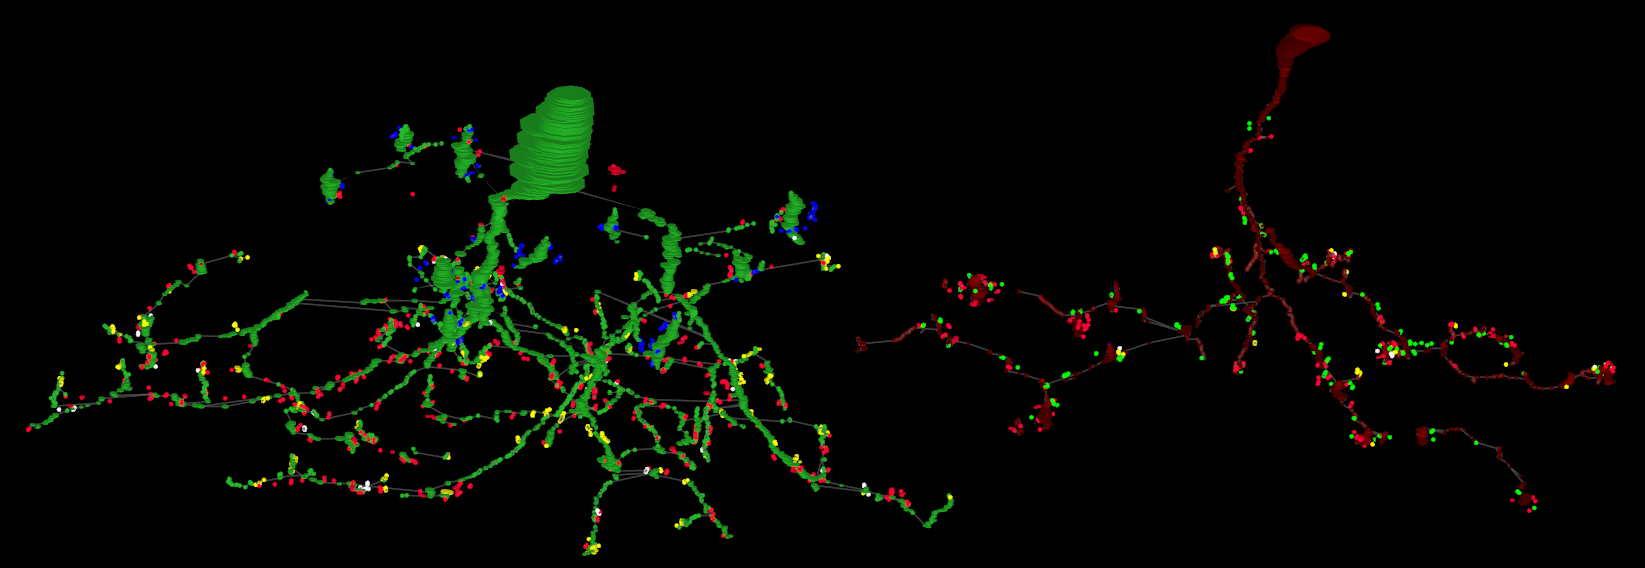
Morphology
Morphology graphs map each annotation to a node. Edges represent links between annotations. The position information is preserved to create a 3D model of the structures.
- GET /export/morphology/( Format )
Returns a 3D graph using annotations to determine node position.
Nodes with a glowing effect are involved in a structure link.
- Format:
TLP - Tulip file format
JSON - Java script object notation
- Query Parameters
id – ID numbers of cells to include in connectivity graph. Commas separate multiple IDs.
stick – When set to a number greater than 0 the morphology graph is simplified. Only nodes representing process terminations or branching points are represented.
- Response Headers
Content-Type – text/plain
Example request
Get the morphology of cells 180 and 476.
http://websvc1.connectomes.utah.edu/RC1/export/morphology/tlp?id=180,476
Navigation between Viking and Tulip
Tulip to Viking: Morphology nodes in Tulip contain a LocationInViking column. The contents of that column can be copied into the clip board. Then in Viking use CTRL+G and paste the coordinates to jump to that location
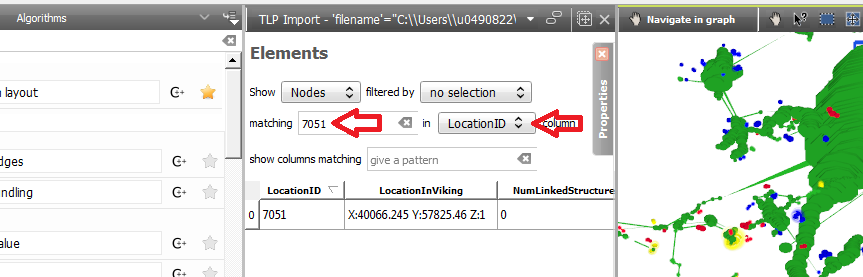
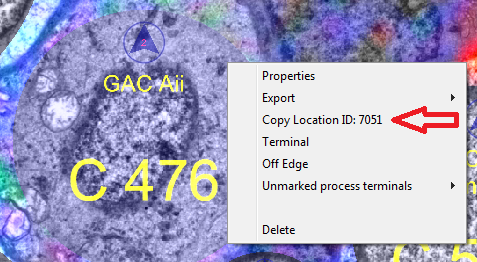
Viking to Tulip: The context menus for annotations in Viking contain a Copy Location ID column. Selecting that option puts the ID into the clipboard. Then switch to Tulip and use the ID value to search the LocationID column of all nodes. The resulting node matches the annotation in Viking.
Viking Copy Location ID context menu
Tulip search UI